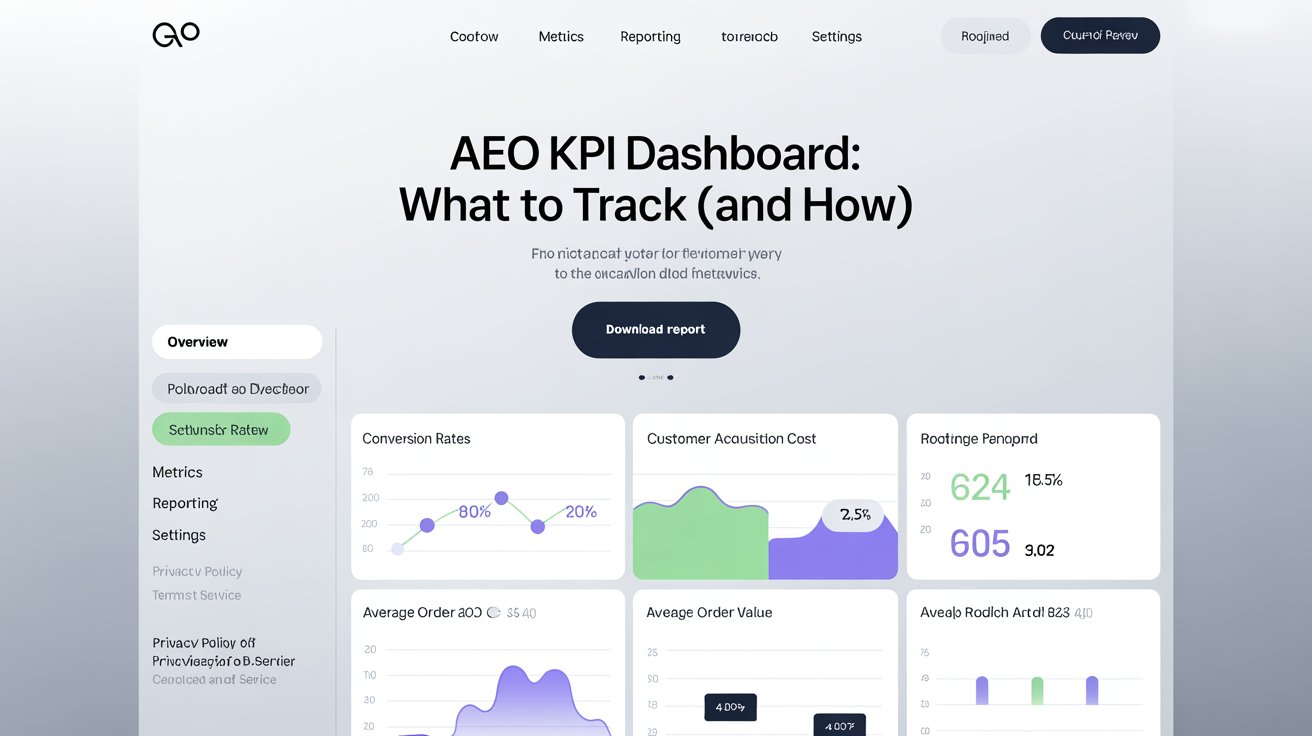
AEO KPI Dashboard: What to Track (and How)
A detailed guide to measuring Answer Engine Optimization (AEO) performance. Learn how to filter AI Overview queries in GSC, track referral traffic from Perplexity and Copilot, and monitor brand mentions and citations for true AEO ROI.

AEO KPI dashboards are the new backbone of AI search reporting. Traditional SEO dashboards focused on keyword rankings, backlinks, and traffic, but Answer Engine Optimization requires a different lens: impressions and clicks from Google AI Overviews, referrals from Perplexity, and visibility within Bing Copilot. The right dashboard reframes SEO performance around citations, discoverability, and trust in generative engines.
The foundation of any KPI dashboard is Google Search Console filtering. Google now provides labeled impression and click data for AI Overview queries. By segmenting these results from traditional blue links, you can measure whether your AEO efforts are creating incremental reach. This visibility uplift is often the first hard proof that answer-first optimization is working. A good practice is to benchmark coverage of AI-triggering queries before and after implementing techniques like schema optimization schema optimization.
Beyond Google, referral tracking from Perplexity and Bing Copilot is crucial. Both engines pass unique referral parameters when users click through. By building custom dimensions in GA4 or Looker Studio, you can separate AI-first traffic from organic. Even more valuable is connecting these referrals to downstream conversions—consultations booked, leads generated, or revenue attributed. This shows executives that AEO is not just visibility but pipeline impact.
Brand mentions expand the KPI picture. Generative engines sometimes cite you by name without linking, especially in long-form answers. Tracking these mentions across forums, media, and AI summaries is essential for gauging authority. Tools like Brandwatch, Talkwalker, and SEMrush alerts can monitor where your firm is appearing in conversations, even without direct traffic.
Visual documentation matters. AI answers are dynamic, so capturing screenshots of citations in AI Overviews and Perplexity should be standard operating procedure. Many agencies are now creating monthly citation decks, which combine screenshots with analytics to show clients tangible proof of AEO wins. It also protects against volatility when models or interface designs shift.
The most advanced KPI dashboards integrate AEO, GEO, and automation metrics into a single pane of glass. Alongside impressions and referrals, they layer in E-E-A-T signals, schema health checks, and automation outcomes like email nurture conversions triggered by AI referrals. This holistic approach aligns AEO with revenue growth rather than vanity metrics. See our AEO Content Audit Guide for steps on spotting optimization gaps before they show up in your dashboard.
Want an AEO KPI dashboard designed for your firm? Agenxus’s AI Search Optimization service includes a metrics playbook, dashboard setup, and ongoing monitoring so you can prove ROI from AI-driven search visibility.
Sources
Frequently Asked Questions
What KPIs matter most for AEO?▼
Can I isolate AI Overview traffic in Google Search Console?▼
How do I measure traffic from Perplexity or Bing Copilot?▼
Why are brand mentions important for AEO?▼
What tools can I use to build an AEO dashboard?▼
Is AI Search Citing Your Website?
Our 42-point AEO audit reveals exactly why AI systems like ChatGPT, Perplexity, and Google AI Overviews cite your competitors instead of you — and gives you the fixes to change that.
